PlayTown
Invest in PlayTown
This brief is for invited investors and partners. Sign in with the email address Ken invited.
No invitation? Email Ken → · Not indexed by search engines
PlayTown
Founder's Pitch Retail Sophisticated
Overview Financial Model Revenue Buildup Scenario Derivation IPO Basis
Pre-launch round · Two-company structure · Rawang, Selangor

The financial brief.

Two companies. One asset. Four scenarios. Asset Co raises RM 5m (Ken RM 3m subscribes for 60%, External RM 2m for 40%) — bond-like Operator Fee yield. Marketing Co raises RM 5m cash (RM 3.8m new equity + RM 1.2m RPS) on top of RM 3m notional founder pre-money → RM 6.8m equity post-money — growth + IPO. Every number on this page traces back to the bottom-up financial model and the locked cap table.

RM 6.8m
MarCo equity
post-money
1.79×
Asset Co
Y5 LEAP exit · 13.4% IRR
14.7×
MarCo Base
at RM 200m IPO
Y5
Combined payback
(Base · LEAP-driven)
Operator insight · the founder discovery

We didn't predict this. We watched it.

Over six years operating MetaHub, we noticed something strange. Every tournament, league, holiday camp and corporate day brought more than participants.

Parents came. Siblings came. Grandparents came.

Entire families arrived because of the programming. Yet almost every venue was built only for the player.

PlayTown began with a simple question:
What if the venue served everyone who came through the gate?

Disney proves the psychology. MetaHub proves the local demand. PlayTown is the productized solution. Every number in the Investment Thesis below is built on this observed gap — not a hypothesis.

Investment thesis

Will it actually make money? Five questions.

The honest test of any pre-revenue thesis — every category-creating play has to answer these. PlayTown's answers are below, each with the proof point that backs it.

1Is the demand real?
Yes — primary catchment is 165,000 families with children. Lowyat Group is the anchor tenant providing built-in demand via residential pipeline: 600–1,000 new homes/year bundle PlayTown memberships at handover.
PROOF: Selangor median monthly household income is RM 13,296 (DOSM 2024) — the highest in Malaysia. Catchment gravity model needs only ~22% capture vs 25–40% regional FEC norm.
2Are the unit economics defensible?
RM 30 blended ARPU at 22% catchment capture. RM 1.58m revenue Y1, RM 6.67m peak Y7. Re-entry built into ticket. Combo passes drive sticky weekly visits.
PROOF: Pricing locked Mar 2026: peak entry RM 40, off-peak RM 25, 3-session Splash Park, credit packages 10% bonus from RM 100. Bottom-up operating model.

CAVEAT (pre-launch): Weekly cadence is a design target backed by combo-pass + membership structure, not yet field-observed. The Bear scenarios below model a -30% revenue stress (operator-side underperformance with intact demand). A pure cadence-failure — families visit monthly not weekly, halving expected frequency — would be a ~-50% revenue impact, materially worse than the current Bear. The Asset Co Operator Fee floor still gets paid in a cadence-failure scenario (~RM 9-10m cumulative Y6-Y12 floor revenue), but MarCo returns would compress further below the Bear shown. The single highest-value pre-launch action is converting "weekly cadence" from a design target into a number — via paid founding-member pre-sales or deposit-backed membership commitments.
3What's the structural moat?
Three layered moats: (a) Lowyat Group lease + RM 6m site infrastructure, (b) 187,000 sq ft scale that competitors cannot replicate without 2-year build-outs, (c) "Rain Promise" 30-day re-entry that converts weather risk into retention.
PROOF: Closest competing FEC in catchment is < 30,000 sq ft and single-modality. PlayTown is 4 zones (Kampung indoor + Outdoor towers + Splash + Sports) under one gate.
4How do you exit?
Bursa Green Pathway: LEAP gate Y4–5 (MarCo absorbs AssetCo, AC investors exit), ACE listing same Y4–5 raises RM 15–25m to fund Centres 4–7, Main Market IPO Y7–8 at RM 200m mcap base · RM 300m stretch (30% float = RM 60–90m raised — Base funds Centres 8–10, Stretch funds Centres 8–12).
PROOF: Bursa FEC/leisure P/E ceiling 15×. Base RM 200m mcap = RM 13m Y8 PAT × 15×. Stretch RM 300m mcap = RM 20m PAT × 15× (requires either delayed IPO to Y10 for centres to mature, or 9–10 operating centres by Y8). Flagship Centre 1 peak ~RM 3m PAT — weighted Y8 PAT for 7-centre mix lands at RM 10–13m, not RM 30m. Earlier drafts over-claimed at 10× P/E.
5What's the downside? (the load-bearing question)
Real downside — Centre 1 misses its ramp by 30%, permanently, AND no Centres 2–3 get built (no multi-site royalty stream). The Premortem-grade rebuild: bear case is bottom-up, not just a haircut on the baseline. Multi-site royalty income is structurally removed because the conditionality (Centres 2–3 require Centre 1 proof) is honest. Y12 terminal recomputed without multi-site EBITDA and with multiple compression (6× not 10×, no growth story). No ESOP dilution applies — equity holders keep 100% of stake. Outcomes (per RM 500k sophisticated ticket):

Bear (no re-tenant): Asset Co 1.47× / 5.2% IRR / Y10 payback. MarCo 2.52× / 10.7% IRR / Y10. Combined 1.99× / 8.4% / Y10. Investor recovers principal + low-single-digit IRR on AC, mid-single on combined. This is the honest underwriting bear — derived bottom-up from the locked AC P&L (PT revenue × 0.70, Lowyat rent + overhead + capex + depreciation held constant, OpFee variable share recomputed year by year). Aggregate AC distributable falls to 72.7% of baseline.

Bear+ (Asset Co re-tenants the Sports zone + F&B Plaza to specialists): Asymmetric trade-off when the failure is operator-side, not demand-side. Asset Co rises to 1.70× / 7.2% IRR / Y9 (specialist royalties, +25% Y6+ uplift on bottom-up bear stream). MarCo falls to 2.14× / 8.6% IRR / Y11 (loses Sports + F&B income on already-stressed cash flows). Combined 1.92× / 8.0% / Y10. Asset Co holders prefer Bear+ (+0.23× MOIC); MarCo holders prefer Bear (+0.38× MOIC); combined slightly favours Bear (−0.07×) — but the option exists for AC investors who want a hedge against operator-side risk. Limitation: the option hedges operator risk, NOT demand risk. In a catchment-failure scenario, Asset Co's residual is approximately fixture liquidation value.
PROOF: MarCo Bear stream removes multi-site royalty contribution `[0,0,0,0,80,160,320,400,480,480,480,480]` (RM '000) from baseline `[-29, 556, 846, 1280, 2433, 1292, 2440, 2298, 2257, 2128, 2030, 1941]`, then applies 0.55× to the remaining Centre 1 + Events stream. Y12 MarCo terminal RM 8m (6× compression, no growth story). Asset Co Bear stream = `[23, 223, 509, 521, 426, 992, 946, 374, 823, 470, 546, 500]` RM '000 — derived bottom-up from the standalone model's P&L logic (PT revenue × 0.70, OpFee variable share recomputed, Lowyat rent + overhead + capex + depreciation held constant). Reproduces locked baseline AC_YR to zero error before stressing. Bear+ Asset Co Y6+ uplift = +25% on bottom-up bear stream (specialist royalty income). All four scenarios verifiable in the IPO Math calculator below.
The verdict: the thesis works if you accept that family entertainment in Malaysia has been chronically underbuilt for the income band the country has reached. Under the Premortem-grade downside (Centre 1 misses ramp 30%, no Centres 2-3 built, no royalty stream), investors recover principal at low-to-mid-single-digit IRR (combined Bear ~8.4%, Bear+ ~8.0%; AC alone 5.2% / Bear-grade). Asset Co's exposure is partially hedged by its zone-re-tenant call option for operator failure scenarios only — catchment failure remains an unhedged tail. The IPO is the upside, not the survival path; the bear is the floor, not a baseline.
The operating model

The Family Multiplier.

Traditional venues monetize the participant. PlayTown monetizes the Family Multiplier.

THE EVENT
One youth football tournament. 20 players.
The participants pay for court time. The venue serves them. The model stops there.
THE MULTIPLIER
80 parents and siblings show up too.
They pay nothing, get nothing, leave underserved. PlayTown is built for them.
The leagues drag them in.
The campus keeps them there.
Programming engineers the Shared Energy State at scale. The participants are the demand engine. The campus serves the 80% who arrived because of the programming.
Honest framing — we know the families are already there (six years observed). PlayTown is designed to convert passive attendees into active participants. The spectator-spend is the bet, not the assumption.
Two-company architecture

One asset. Two structurally separated cash flows.

Asset Co holds the tenancy + every fixture and earns a contractual Operator Fee. Marketing Co operates the venue, runs events, and licenses the brand to multi-site partners. The fee structure means Asset Co has yield-floor predictability; MarCo carries the growth optionality.

Asset Co Yield

RM 5m equity raise · post-money RM 5m · TCC valuation RM 4.9–5.3m
Cap table: Ken RM 3m / 60% · External RM 2m / 40% · no dilution events
  • Holds Lowyat tenancy + every fixture, fit-out, play equipment
  • Fixed-fee floor + variable-share Operator Fee from MarCo (RM 200k Y1 → RM 1,000k Y6+)
  • 10-year SLN depreciation = RM 500k/yr Y1–Y10
  • Renewal CAPEX Y5 / Y8 / Y10 (RM 300k / RM 500k / RM 250k)
  • No RPS exposure · Annual overhead RM 60k
  • Exit: Y5 LEAP consolidation buyout RM 6.59m (Base/Stretch) OR Y12 residual fixture value RM 1m (Bear/Bear+ 12-year hold)
  • Note: the 12-year P&L above feeds the LEAP buyout NPV. Under Base/Stretch, AC investors are off the cap table after Y5 — the Y6–Y12 depreciation tail, Y8/Y10 renewal capex, and Y12 terminal accrue to the consolidated Asset + Operating Co, not to AC holders.

Marketing Co Growth

RM 3m founder pre-money (notional) + RM 5m cash raise · equity post-money RM 6.8m
Cash raise breakdown: RM 3.8m new equity (Ken RM 1.5m co-invest + External RM 2.3m) + RM 1.2m RPS (External, debt-like, off equity table)
Equity post-money: Ken 66.2% · External 33.8%
  • Operates the venue · pays Operator Fee to Asset Co
  • External events business (Y2 ramp · 50%/yr to RM 2m · 40% EBITDA margin)
  • Multi-site licence fees (Site 2 Y5 · Site 3 Y7 · 8% of gross revenue)
  • RPS RM 1.2m held externally (8% coupon Y2–Y6, principal redemption Y6) — debt-like, off the equity cap table
  • Terminal Y12: RM 25.5m baseline (10× Y12 EBITDA, no IPO) · bottom-up rebuild under bear lands at RM 8m (6× compression, no growth story, no multi-site EBITDA)
  • Listable on Bursa Green Pathway: ACE Y4 → Main Market Y7–8
Lowyat Group (landlord) → RM 6m site infrastructure → Asset Co pays rent → MarCo pays Operator Fee → Asset Co distributes to investors
MarCo operates venue + events + multi-site → distributable cash + Y12 terminal or IPO exit → MarCo investors
Cap table journey

From close to public listing — four stages of dilution.

Every external dollar that enters MarCo dilutes existing holders. The retail calculator in the previous section reflects the full stack — ESOP × ACE × IPO float = 47.25% retention. Founder retains majority through ACE; significant dilution comes only at IPO.

1

Round close

Y0 · Pre-launch round
66%
34%
Ken (RM 3m founder pre-money + RM 1.5m cash co-invest)66.2%
External cash equity (RM 2.3m)33.8%
2

ESOP carve-out

Y2–Y3 · Talent option pool
59.6
30.4
10%
Ken (founder)59.6%
External investors30.4%
ESOP pool10.0%
3

ACE round

Y4–Y5 · 25% new dilution
44.7
22.8
7.5
25%
Ken (founder)44.7%
External investors22.8%
ESOP pool7.5%
ACE round25.0%
4

Main Market IPO

Y7–Y8 · 30% public float
31
16
5
17
30%
Ken (founder)31.3%
External investors16.0%
ESOP pool5.3%
ACE round17.5%
Public float30.0%
Retention math (IPO scenarios): External equity holders retain (1 − ESOP) × (1 − ACE) × (1 − IPO float) = 0.9 × 0.75 × 0.7 = 47.25% of their original stake through to IPO.

Bear scenarios apply 1.0× (no ESOP grants). Under structural underperformance, option grants are not valuable for talent recruitment, so no ESOP carve-out happens. Equity holders retain 100% of their original stake.

RPS holders are off the equity cap table — they receive RM 96k/yr coupon Y2–Y6 plus RM 1.2m principal redemption at end of Y6 (~1.4× MOIC / 8% IRR on the RPS leg).
IPO Math calculator

What does RM 500,000 become?

Slide the ticket, pick a scenario. The calculator runs the full Y0–Y12 cash flow stream — operating distributions × your post-dilution stake + the exit event in the final year — and solves IRR by bisection on the actual cash flows. No geometric averaging. Every cell is audit-traceable.

Your ticket
RM 500,000
Scenario
Bear-30% C1 · no re-tenant
Bear+-30% C1 · re-tenant Sports + F&B
BaseRM 200m IPO Y8
StretchRM 300m IPO Y8
Default 50:50 split — RM 250,000 to Asset Co · RM 250,000 to Marketing Co
Asset CoYIELD
RM 0
Total returned over 12 years
0×MOIC · 0% IRR
Marketing CoGROWTH
RM 0
Loading…
0×MOIC · 0% IRR
CombinedPORTFOLIO
RM 0
Two-co portfolio outcome
0×MOIC · 0% IRR

IPO event breakdown

Year 8 · Main Market listing
Your stake at IPO
0%
Pre-float stake (after ESOP × ACE) → post-float stake (after 30% IPO dilution)
Your stake value at listing
RM 0
Post-float stake × IPO market cap = actual value on listing day (pre-float × mcap overstates by 1/0.7)
Funds raised by MarCo
RM 0m
30% float × IPO mcap → Base funds Centres 8–10 · Stretch funds Centres 8–12
Year-by-year cash flow (audit trail)
YearAsset CoMarketing CoCombinedCumulative
Default 50:50 split between Asset Co and Marketing Co. To adjust the ratio, talk to Ken — subscriptions are independent.

Asset Co under Bear / Bear+ = your stake × bottom-up 12-year distributable cash stream + RM 1m residual at Y12. Bisection IRR on the full cash flow.
Asset Co under Base / Stretch = stake × Y1–Y5 distributable cash + Y5 LEAP buyout (NPV of Y6–Y12 + terminal at 8% discount × 1.2 fair-value premium = RM 6.59m). AC investors exit at the LEAP consolidation event when MarCo absorbs AssetCo to become a vertically integrated Asset + Operating Co.
Marketing Co entry is at RM 6.8m equity post-money (RM 8m total balance-sheet capital less RM 1.2m RPS liability).

Bear scenarios (Premortem-grade honest rebuild) — Centre 1 underperforms ramp by 30% permanently AND no Centres 2–3 get built. Multi-site royalty stream is removed from the MarCo bear math (because no Centres 2–3 means no royalties — consistent with the Capital Roadmap conditionality banner above). Y12 MarCo terminal recomputed bottom-up at RM 8m (Y12 EBITDA × 6× compression for "no growth story") instead of half-discounting a multi-site-inflated baseline.

Asset Co Bear stream is derived bottom-up from the locked P&L — NOT a flat multiplier on baseline AC_YR. Method: recompute Operator Fee at PT_REV × 0.70 (variable share above RM 2.5m threshold drops, RM 1m floor preserved), hold Lowyat rent (escalating schedule), AC overhead RM 60k, depreciation RM 500k Y1–Y10, and renewal capex (Y5/Y8/Y10) all CONSTANT. Validated against the standalone model: baseline reproduces locked AC_YR to zero error. Bear aggregate AC distributable = RM 6,353k vs. baseline RM 8,742k = 72.7%. Year-by-year multipliers range 0.58 (Y8 capex year) to 0.77 (steady state). No ESOP dilution applies under Bear (options not valuable on struggling venture).

Bear (no re-tenant): MarCo stays sole operator across all four zones + food plaza.

Bear+ (re-tenant): Asset Co exercises its call option and brings in specialist operators for the Sports zone + F&B Food Plaza. Trade-off: Asset Co gains specialist royalties (+25% Y6+ uplift on bottom-up bear stream); MarCo additionally loses Sports + F&B revenue (×0.85 haircut). Critical limitation: Bear+ hedges operator-side failure only. If the failure is demand/catchment (PlayTown doesn't draw families in Rawang), specialists won't take a dead campus either — Asset Co's residual reduces to fixture liquidation value.

Base / Stretch apply the full dilution stack to MarCo (ESOP × ACE × IPO float = 47.25% retention) and exit at Y8 at the IPO market cap. Asset Co exits separately at Y5 LEAP consolidation (consideration mechanic open: cash buyout, share swap, or hybrid).

Combined sums both companies' cash flow streams and solves IRR on the portfolio.
Capital roadmap

From Pre-launch to Main Market.

PlayTown follows the Bursa Green Pathway — a recognised progression from private to ACE Market to Main Market. Each stage funds the next leg of expansion. Pre-launch round funds Centre 1 + Phase 1B; founder cash + Y1–Y3 retained ops fund Centres 2–3; ACE round (Y4–5) funds Centres 4–7; Main Market IPO (Y7–8) funds Centres 8–10 (Base) or Centres 8–12 (Stretch).

Sequential conditionality — read this first: the IPO returns shown in the calculator's Base/Stretch scenarios depend on a cascade of stage gates. Each stage below is conditional on the prior stage proving out. If Centre 1 (Rawang) misses its ramp, Centres 2–3 don't get built, the ACE round doesn't price, the multi-site royalty stream never compounds, the EBITDA threshold for Main Market isn't reached, and the RM 200m–300m IPO outcome does not materialise. The Bear / Bear+ scenarios in the calculator model exactly this stall — they are the actual default if any stage gate fails. The IPO is the upside path, not the survival path.
NOW
PRE-LAUNCH

Pre-launch round In progress

Two-Co structure raises RM 10m total: Asset Co RM 5m (private placement, holds tenancy + fixtures) + Marketing Co RM 5m (RM 3.8m equity + RM 1.2m RPS). Founder cash commitment RM 4.5m of the RM 10m total.

Asset Co RM 5m (Ken RM 3m + External RM 2m) · MarCo RM 5m (Ken RM 1.5m + External RM 3.5m of which RM 1.2m RPS) · total cash raise RM 10m this round
Y1
LAUNCH

Centre 1 opens — Rawang, 28 Feb 2027 Live operations

Phase 1A (187,000 sq ft): Indoor Kampung, Outdoor Twin Towers + Bunga Raya climbers, Splash Park, sports channels. Y1 modelled revenue RM 1.58m, ramps to RM 6.67m peak Y7.

Operating CF positive Y2 · Operator Fee to Asset Co RM 200k Y1 → RM 1,000k Y6+
Y2
EXPAND

Phase 1B build-out

Adds Treehouse anchor + expanded sports indoor + Phase 2A food plaza pre-build. Funded from retained operating cash flow + Phase 1B capital (RM 2m).

RM 2m additional capex · funded from operations
Y3
PROVE

External events business + Centres 2–3 build-out Pre-listing

Events business hits ramp target. Centres 2–3 (KL · Penang) site selection finalised, fit-out begins — funded from founder cash + Y1–Y3 retained operating cash, not from a capital raise. By end-Y3, Centres 2–3 are ~60% built; ACE filing prep begins in parallel.

MarCo EBITDA > RM 800k · external events RM 650k revenue Y2 → RM 2m target
Y4–5
LEAP + ACE

LEAP consolidation → ACE Market listing 25% new dilution Gate: Centres 2–3 operating + ramping

LEAP entry consolidates the two-company structure — MarCo absorbs AssetCo to become a vertically integrated Asset + Operating Co. Asset Co investors exit at this gate at fair-value consideration (NPV × 1.2 premium ≈ RM 6.59m → 1.79× / 13.4% IRR). Mechanic open: cash buyout, share swap, or hybrid — not locked at round-close. Step-up to ACE Market raises RM 15–25m to fund Centres 4–7 build-out. Centres 2–3 already opened Y4 from founder cash + Y1–Y3 cash recovery.

LEAP: no raise · AC investors out at 1.79× / Y5 · ACE raise ~RM 15–25m · funds Centres 4–7
Y5–7
SCALE

Centres 4–7 build-out · multi-site royalties compound Gate: ACE round funded + Centres 2–3 operating

Centre 4 (Johor Bahru) opens Y6. Centres 5–6 (Klang Valley South · Sabah) open Y7. Centre 7 (Sarawak) opens Y8 just before IPO transfer. MarCo's 8% multi-site licence fee compounds across each new site. By Y8, MarCo EBITDA tracks toward ~RM 30m run-rate ≈ ~RM 13m PAT after D&A across the asset-heavy 7-centre base (D&A ~RM 10–12m across 7 centres + interest + tax). RM 13m PAT × 15× P/E = RM 200m Base mcap. Stretch case requires RM 20m PAT (≈ RM 45m EBITDA) — achievable with delayed IPO to Y10 OR 9–10 mature centres by Y8.

Centres 4–7 = ~RM 18m total capex (RM 7m + RM 5m + RM 3m + RM 3m per Ken's locked CAPEX plan) · funded from ACE proceeds + retained earnings
Y7–8
IPO

Main Market IPO RM 200m base · RM 300m stretch · 30% float Gate: 7+ centres + RM 13m PAT × 15× P/E (base) or RM 20m PAT (stretch)

Marketing Co transfers from ACE to Main Market. Base RM 200m mcap × 30% float = RM 60m raised → funds Centres 8–10 directly (Centres 11–12 from post-IPO retained earnings + minor follow-on). Stretch RM 300m mcap × 30% = RM 90m → funds Centres 8–12 directly. Both scenarios assume the 15× P/E ceiling for Bursa FEC/leisure comps. The IPO is the exit event for this round's equity investors who haven't already exited via secondary markets. (RPS already redeemed at Y6.)

Base RM 200m mcap → 14.7× MOIC / 41% IRR for this round's entry · Stretch RM 300m → 21.6× / 49% IRR
Y8-12
SCALE 2

Centres 8–12 + regional expansion Gate: Main Market IPO priced + RM 60m+ raised

Post-IPO build-out. Base case: RM 60m IPO proceeds fund Centres 8–10 directly; Centres 11–12 follow from post-IPO retained earnings + minor follow-on. Stretch case: RM 90m proceeds fund Centres 8–12 directly. By Y12, MarCo operates 12 centres with multi-site royalty stream. Asset Co investors already exited at Y5 via the LEAP consolidation event at 1.79× / 13.4% IRR — they are no longer in the cap table by this stage.

Y12 terminal Asset Co RM 1m · MarCo public-co market cap dependent on Y12 EBITDA × multiple
12-year trajectory

One centre to twelve · LEAP → ACE → Main Market.

Rawang is Centre 1. The build-out rides Bursa's three-stage listing escalator: LEAP as the consolidation gate (MarCo absorbs AssetCo, AC investors exit at fair-value buyout), ACE Market at Y5 raises RM 15–25m to fund Centres 4–7, then Main Market at Y8 raises RM 60m (Base) funding Centres 8–10 — or RM 90m (Stretch) funding Centres 8–12. Each subsequent location is own-and-operate or licence-and-royalty (8% revenue royalty per site, operator does the heavy lifting).

Y1
Centre 1
Rawang
(Anchor)
Y2
+
Phase 1B
build-out
Y3
+
External events ramp
LEAP bridge optional
Y4
+2
Centres 2–3
KL · Penang
Y5
ACE + LEAP
Listing event
MarCo absorbs AssetCo · raises RM 15–25m · AC investors exit @ 1.79×
Y6
+1
Centre 4
Johor Bahru
ACE-funded
Y7
+2
Centres 5–6
Klang Valley S. · Sabah
ACE-funded
Y8
IPO + 1
Main Market
RM 200m base · Centre 7 Sarawak
Y9
+2
Centres 8–9
Post-IPO
Y10
+1
Centre 10
Regional
Y11
+1
Centre 11
Singapore?
Y12
12
Full footprint
+ regional
The moat stack

Three layers. None of them the building.

A new entrant builds a venue cold. PlayTown arrives with six years of operator infrastructure that competitors would need a decade to assemble.

LAYER 1 · DEMAND MOAT
Portable demand.
  • MetaHub organizer relationships (6 yrs)
  • Academy partnerships
  • Coach networks
  • School + corporate event clients
Ken arrives with demand, not begging for it.
LAYER 2 · OPERATING MOAT
Programming IP.
  • League formats refined over 6 yrs
  • Tournament scheduling know-how
  • Holiday camp programmes
  • The "what brings the 8th visit" engine
Programmed cadence, not heroic 'they'll come back'.
LAYER 3 · COMMERCIAL MOAT
Organizer lock-in.
  • Revenue share on attendee family spend
  • Turnkey event operations (we run it)
  • Venue hire subsidized by ancillary spend
  • Organizers can't run a better event elsewhere
The network + the commercial structure, not just goodwill.
Anyone can build courts. Anyone can build slides. Nobody else arrives with the operator network, the league IP, and the family-multiplier economics already running.
Failure mode analysis

Where others failed — and how we don't.

FECs in Malaysia and Southeast Asia have a brutal track record. We mapped four named failure modes from public records and operator interviews, then designed PlayTown to structurally avoid each.

Mode 1 · Pricing trap

Per-visit pricing kills weekly-repeat economics

Premium career-play FECs charge RM 80–100 per child per visit. At that ARPU, the price ceiling forces a monthly-or-less visit cadence — and the operator can't carry fixed costs through low-traffic weekdays.
PlayTown is built for weekly cadence at RM 30 blended ARPU. Combo passes drive sticky re-entry. Splash Park 3-session structure means a family can return Saturday and Sunday for one combo price. The Rain Promise 30-day re-entry adds another layer of stickiness.
Mode 2 · Weather denial

Outdoor-led FECs claim "weather-proof"

Operators with outdoor-heavy footprints often understate rain-day revenue impact in pre-launch models. Then monsoon-season weekends arrive and the gate count collapses.
Indoor Kampung is ~4,000 sq ft of 187,000 sq ft total — it holds 25–30 families at saturation, not the weekend crowd. On a thunderstorm afternoon, Splash and the outdoor towers close. The honest math: PlayTown can keep doors open for indoor-eligible families (vs. pure-outdoor competitors that close entirely), but a sustained wet weekend caps daily revenue at roughly 30% of dry-day baseline. The Rain Promise (30-day re-entry credit) is a retention + cost-saving mechanic that defers demand into the next dry weekend — it does not recover same-day revenue. The financial model conservatively books rain days at 30% of dry-day revenue and applies a Selangor wet-day calendar of ~25% of weekends. Investors should underwrite "open through the rain" — not "weather-proof."
Mode 3 · Location-only thinking

Mall-based FECs depend on mall traffic

FEC operators that lease inside shopping malls inherit the mall's footfall — which means they're priced like a tenant, not an anchor. When the mall declines, the FEC declines.
PlayTown is a destination on a 187,000 sq ft Lowyat-anchored campus. The residential pipeline (1,000 new homes/yr bundled with memberships) drives demand independently of mall foot-traffic. PlayTown IS the anchor, not the tenant.
Mode 4 · Capital structure

Single-Co structure forces yield investors to take operating risk

Most FEC raises lump CAPEX yield + brand growth into one share class. Yield-seekers carry IPO timing risk; growth-seekers carry venue operating risk. Mispriced for both audiences.
PlayTown's Two-Co architecture structurally separates yield (Asset Co) from growth (Marketing Co). Asset Co's Operator Fee floor is contractual; MarCo's upside is uncapped. Each investor picks the risk profile they want — or splits the ticket as the calculator defaults.

Operating stress + the asymmetric downside option

If MarCo revenue drops 30% permanently (the Premortem-grade structural-weakness scenario), the Operator Fee still hits its fixed-fee floor: Asset Co receives at minimum RM 200k Y1 → RM 1,000k Y6+, paid because MarCo remains solvent under -30% (the operating model survives the haircut even with fixed costs unchanged).

Asymmetric option — Asset Co's strategic re-tenant call (operator-risk hedge): If a single operator structurally underperforms but the underlying demand is intact, Asset Co can re-tenant specific zones to specialist operators. Two zones are the cleanest re-tenant candidates: (1) Sports — pickleball is the fastest-growing recreational sport in SEA and football academy networks are well-established M$200m+ businesses. (2) F&B Food Plaza — 8 stalls operated by family-scale stallholders over a 6–10 year hold meaningfully under-capitalise the F&B opportunity; a corporate F&B operator pays better rent + revenue share.

What the option does NOT hedge: demand-side failure. If the PlayTown campus concept fails to draw families in Rawang (location or product-market fit miss), a specialist pickleball academy doesn't want courts in a dead campus either. The re-tenant option hedges operator-side failure (MarCo executes poorly); it does not hedge catchment-side failure. In a catchment-failure scenario, Asset Co's residual is approximately the fixture liquidation value (modeled at RM 1m Y12 terminal).

The trade-off is honest: Asset Co GAINS specialist royalty income (+25% Y6+ uplift on bottom-up bear stream); MarCo LOSES Sports + F&B revenue (×0.85 haircut). Modeled in the calculator's Bear+ scenario: Asset Co 1.70× / 7.2% IRR / Y9 vs. Bear 1.47× / 5.2% / Y10 (AC prefers re-tenant, +0.23× MOIC). MarCo 2.14× / 8.6% IRR / Y11 vs. Bear 2.52× / 10.7% / Y10 (MarCo prefers no re-tenant, −0.38×). Combined 50:50 portfolio: Bear 1.99× / 8.4% / Y10 vs. Bear+ 1.92× / 8.0% / Y10 — combined slightly favours Bear (−0.07×), but Asset Co holders who want a hedge against operator-side risk can elect the Bear+ path. This optionality is structurally absent from single-tenant FEC vehicles — Asset Co's downside is bounded by the call option, not by MarCo's struggle.

0
Years Asset Co
distributable cash
goes negative under
30% permanent stress
What it actually looks like

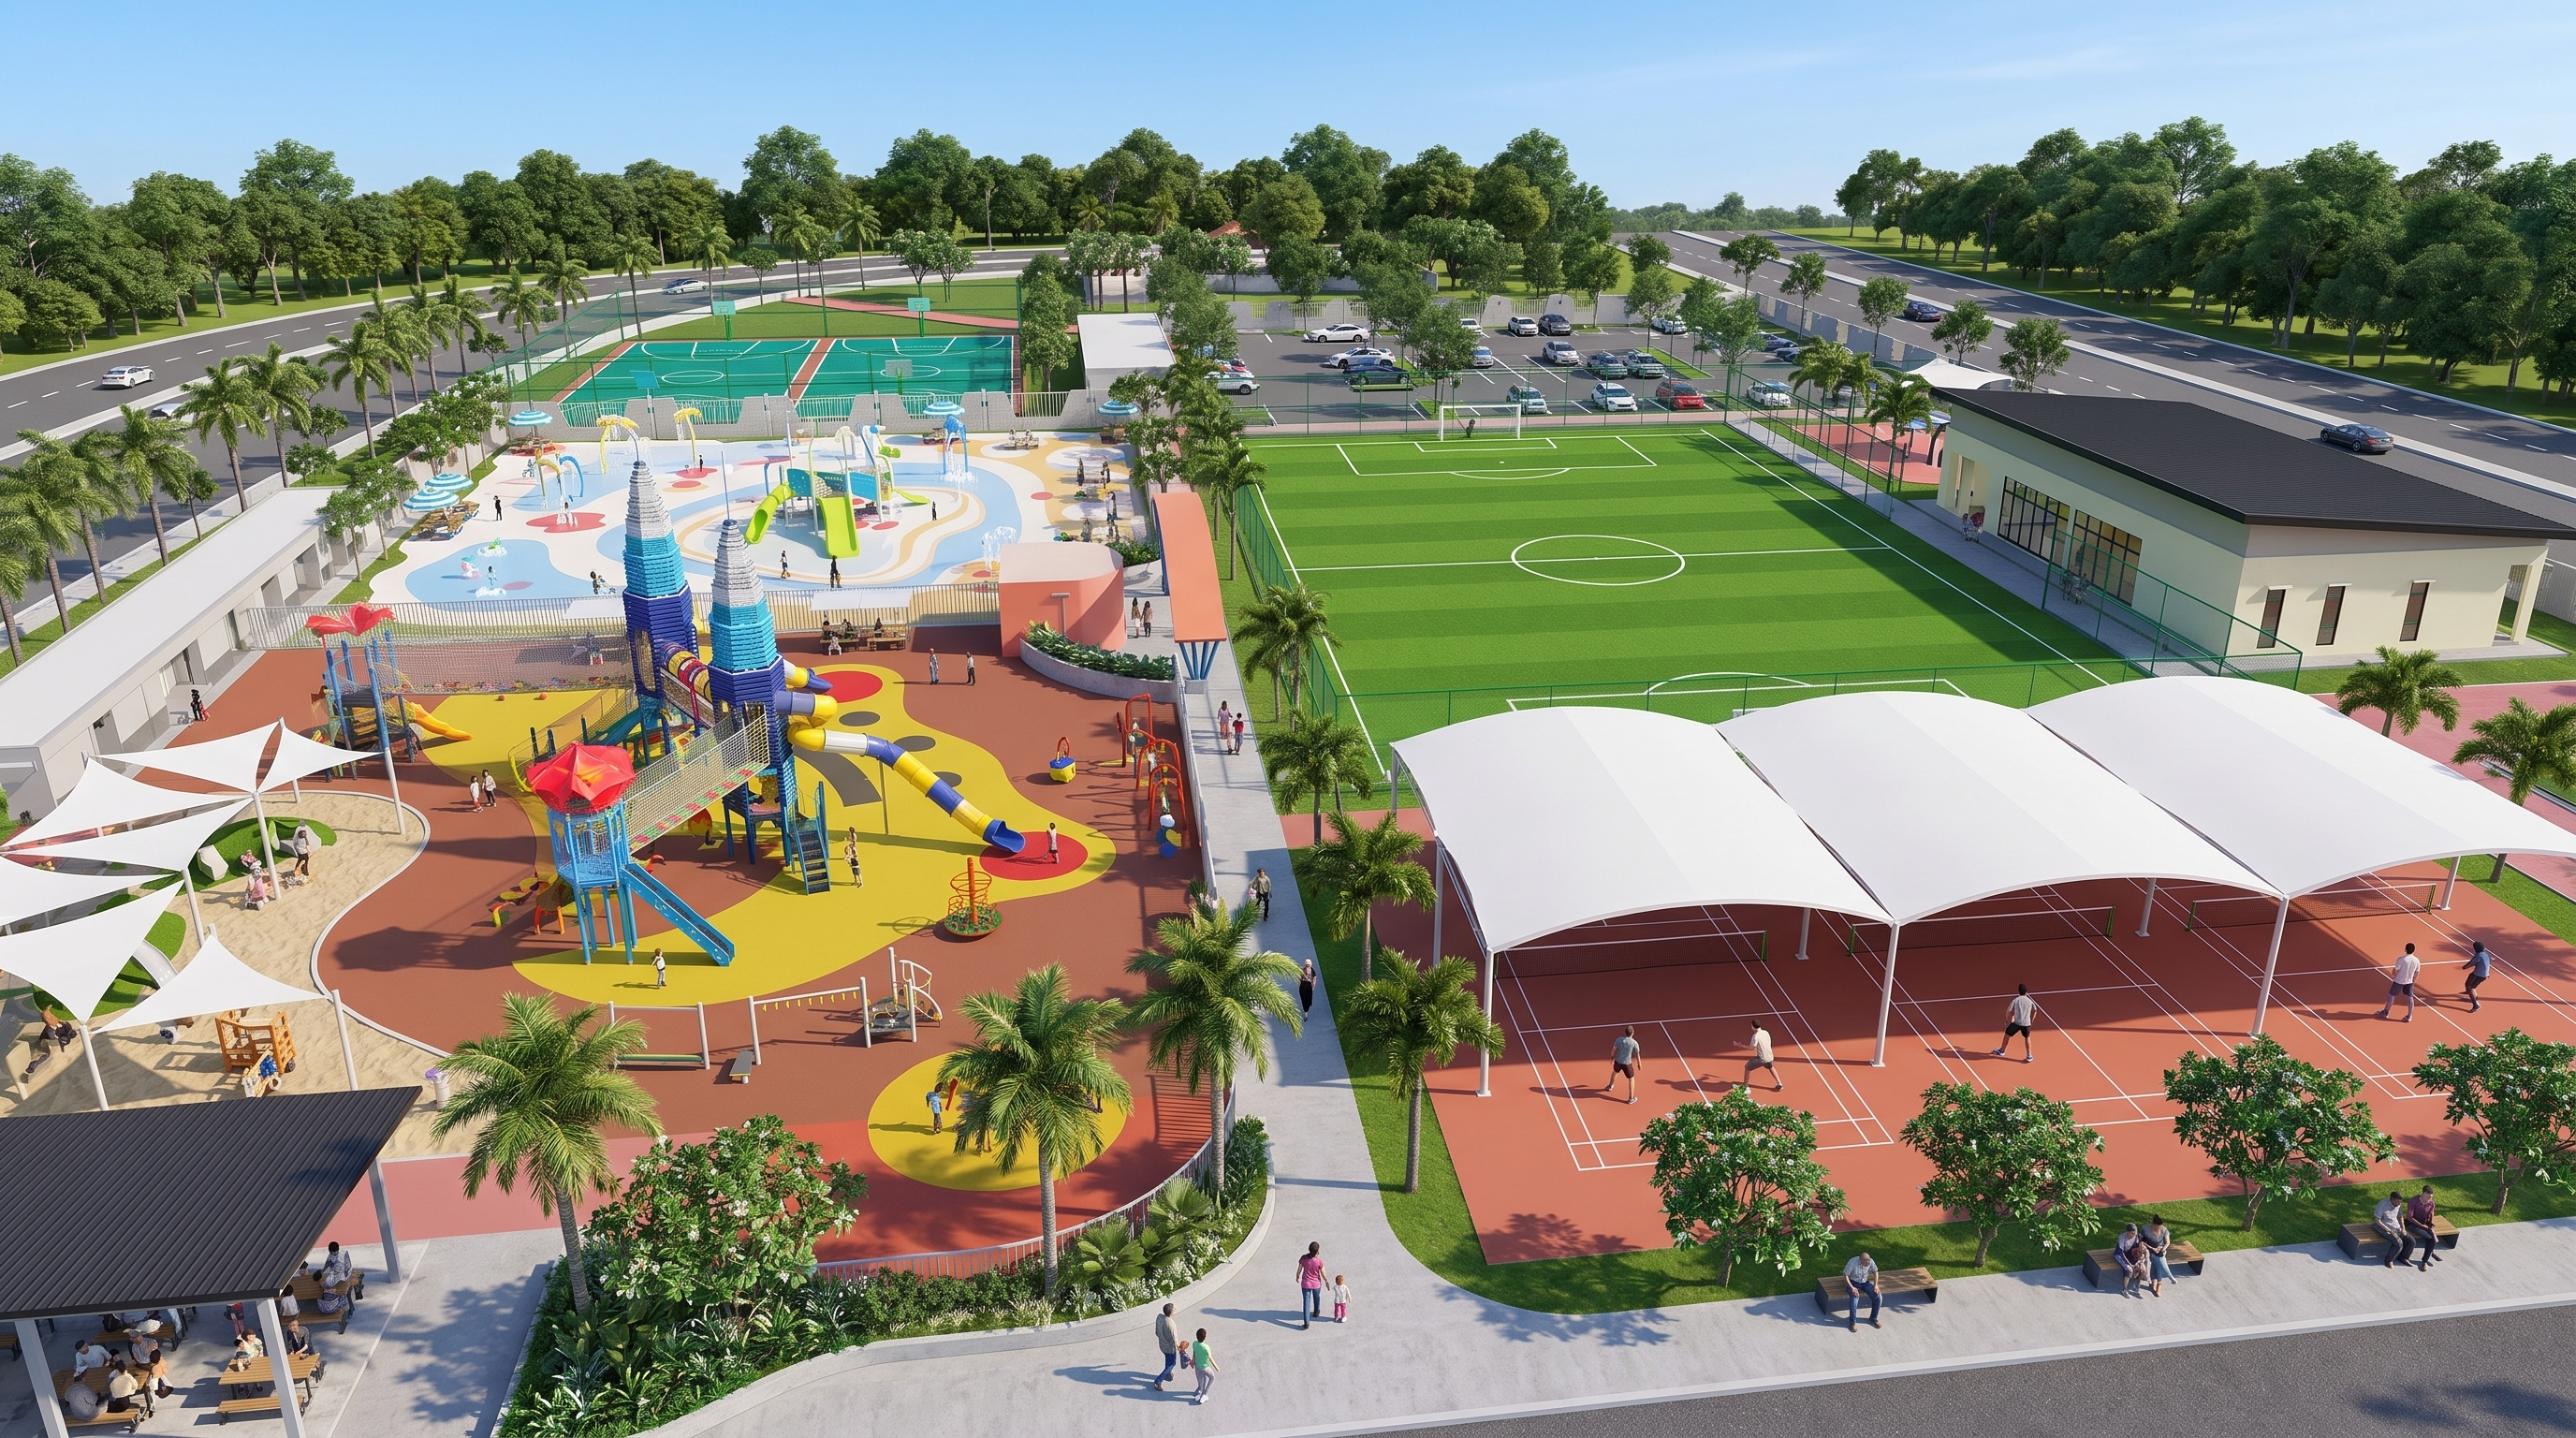
PlayTown Rawang — the architectural anchor.

Twin KLCC-inspired climber towers as the visual signature. Bunga Raya (Malaysia's national flower) anchors the secondary climber. The whole campus is a model of Malaysia itself — Indoor Kampung, Outdoor City/Twin Towers, Splash Pulau (islands).

PlayTown Rawang Twin Towers + Bunga Raya architectural render
PlayTown Rawang Phase 1A — concept renderIndoor Kampung (left) · Outdoor Twin Towers + Bunga Raya climbers · Splash Park · sports channels
Founder commitment

The bet at the centre.

No external investor takes more risk on PlayTown than the founder and the landlord. Ken commits RM 4.5m of his own capital alongside the raise; Lowyat Group commits RM 6m of site infrastructure plus a multi-year membership-bundle pipeline. RM 10.5m of value at risk before any external investor enters.

Ken Ong · Founder/CEO

  • Second-time operator. Previously founded MetaHub.
  • Asset Co: RM 3m cash subscription → 60% of Asset Co (External RM 2m → 40%)
  • Marketing Co notional founder pre-money: RM 3m — founder equity granted for the IP, brand concept, and operating playbook brought to the venture. No cash component.
  • Marketing Co co-invest: RM 1.5m cash alongside External cash equity (RM 2.3m) and External RPS (RM 1.2m, debt-like, off equity table)
  • Resulting MarCo position: 66.2% of RM 6.8m equity post-money
  • Total cash deployed: RM 4.5m (RM 3m Asset Co + RM 1.5m Marketing Co)
  • Total equity value at risk: RM 7.5m (RM 3m Asset Co + RM 4.5m Marketing Co including founder pre-money)
  • Disclosure — MetaHub & PlayTown structural separation: MetaHub is operational and restructured for sustainability — a lean team running growing revenue channels (academy partnerships, CCA programmes, advertising banners, event-agent revenue share). The business survived 2025–2026 headwinds by aggressively cutting fixed cost and diversifying topline without inflating headcount.

    A legacy RCPS instrument issued in Sep 2020 during the Covid period remains under active discussion with the existing holder. Context: MetaHub accrued rental obligations through 2020–2022 and repaid all rental dues in full. The original RCPS redemption assumptions reflect a pre-restructure expectation; the structural constraint of football-field rental — a slot-based revenue model with a natural earnings-velocity ceiling — has been the catalyst for a revised resolution path now in negotiation. (This sentence describes a live commercial matter; specific terms and timing are between MetaHub and the RCPS holder.)

    PlayTown is structurally different. Per-visit + membership ARPU, four revenue zones, weekly cadence design — revenue velocity an order of magnitude above slot rental. PlayTown's RPS (RM 1.2m, Y6 redemption) sits inside MarCo, ring-fenced from MetaHub, serviced from MarCo's own operating cash flow.

    Ken's current commitments span MetaHub oversight (lean team running day-to-day), advising the Anyara Hills family development, and pre-launch leadership of PlayTown — with PlayTown the primary focus through the Q1 2027 open.
Total founder cashRM 4.5mRM 7.5m equity value at risk including pre-money

Lowyat Group · Anchor partner

  • RM 6m site infrastructure investment (roads, utilities, frontage)
  • 600–1,000 new homes/year bundle PlayTown memberships at handover
  • Bandar Tasik Puteri — 750,000 reachable population, 165,000 families
  • Lease commitment aligned with 12-year operating model
  • Selangor's highest median household income at RM 13,296/mo
Total Lowyat commitmentRM 6m + pipeline

Want the full data room?

Full financial model spreadsheet, TCC Capital independent valuation, signed Lowyat term sheet, cap table waterfall, construction schedule. Available to qualified sophisticated investors after a 30-minute conversation with Ken.

Meet with Ken  → View the retail brief instead
← Read first
Founder's pitch
The Disney-moment story behind PlayTown. Read this if you haven't already.
Smaller tickets
Retail returns calculator
RM 500 to RM 50,000 ticket sizing with the same cap-table math, simplified for retail.
Playtown Ventures Sdn Bhd · Bandar Tasik Puteri, Rawang, Selangor · ken@playtown.my · partners.playtown.my
This brief is for invited sophisticated investors only. Not an offer to sell or a solicitation to buy securities.